Coverage Reporting
Steps to Plot Coverage Report
- Access your Fullcast instance and switch plans if applicable.
- Click Manage Accounts on the Territories tile.
- Click the Chart View icon (graph).

- Click Coverage Report on the right navigation column.

Fill the Chart Title text box with a name for the chart.
(If the name is not provided, the chart will create the name using the dimensions and measures selected in the following steps)

- Now select the Columns that need to be displayed in the report. Coverage reports include people-based entities like assignments, people, roles, and territory.
- After selecting the columns, select Plot to get the report.
- You can further create a specific report, if needed, by providing appropriate filter conditions.
How to view the coverage report
- The coverage report is displayed in a tabular format with the columns chosen.
- You can hide the column if not needed by using the column chooser option.
- You can change the Fiscal Year and level for which you need to see the details by changing the FY available in the chart.
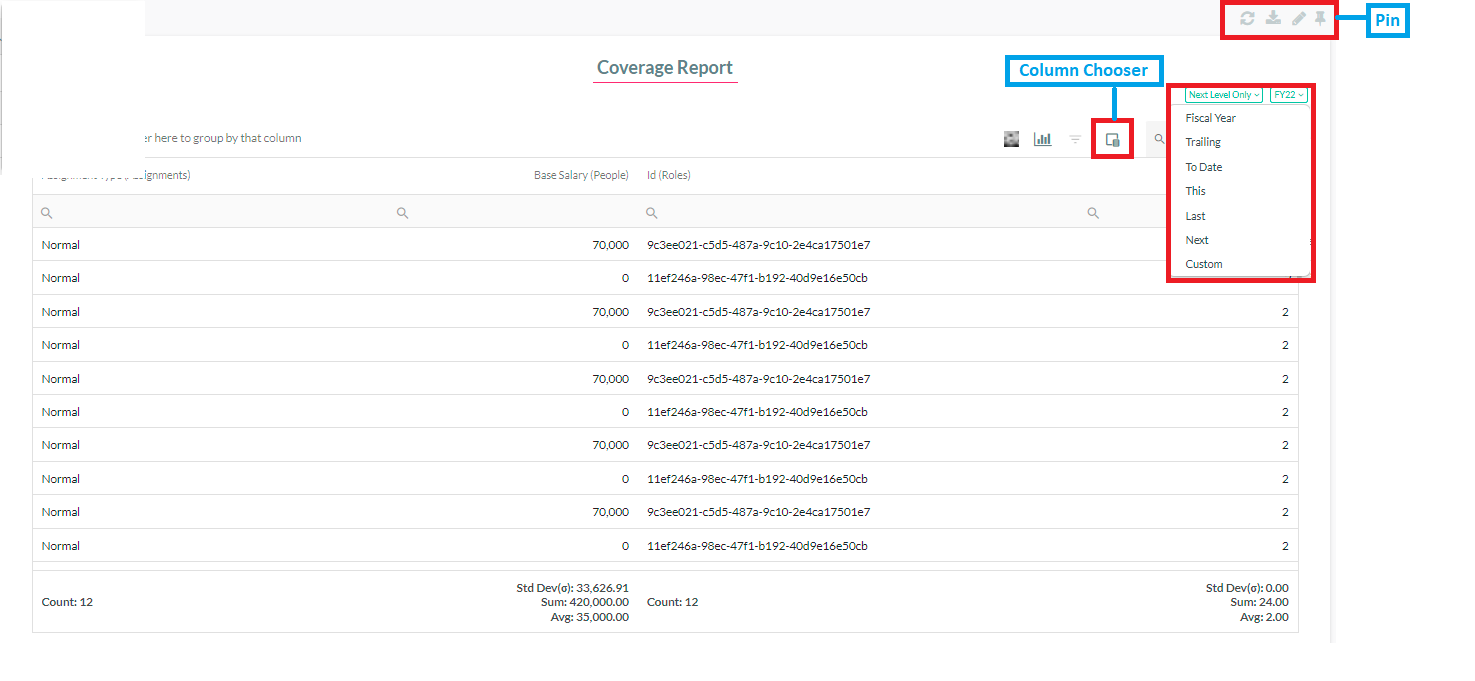
Steps to pin the report to the dashboard
- Select the Pin Chart button.
- The screen that pops up will ask for the Decision center in which the report has to be pinned.
- Pick your choice from the dropdown menu and confirm.
- Now you can see the report pinned in the Rhythm dashboard. Select the Rhythm tab and select the dashboard to which you have pinned the report and now you can view the report in the dashboard.

Steps to remove the chart from the dashboard
- Select the three-dot button on the chart.
- Pick the remove option.
